Analytics on the COVID after quick re-design :: Analytics
Analytics for the previous week (Mon 25 - Sun 31/01) compared to previous design
Sources of traffic - Not affected
- Google (organic): 26%
- Direct traffic: 18%
- PWA (Progressive Web App):10%
Next page visited (% pageviews) - More engagement, mostly going where we want them to go
- Browse support: 48%
- Strategic Framework Business Fund: 16%
- Coronavirus-advice: 10%
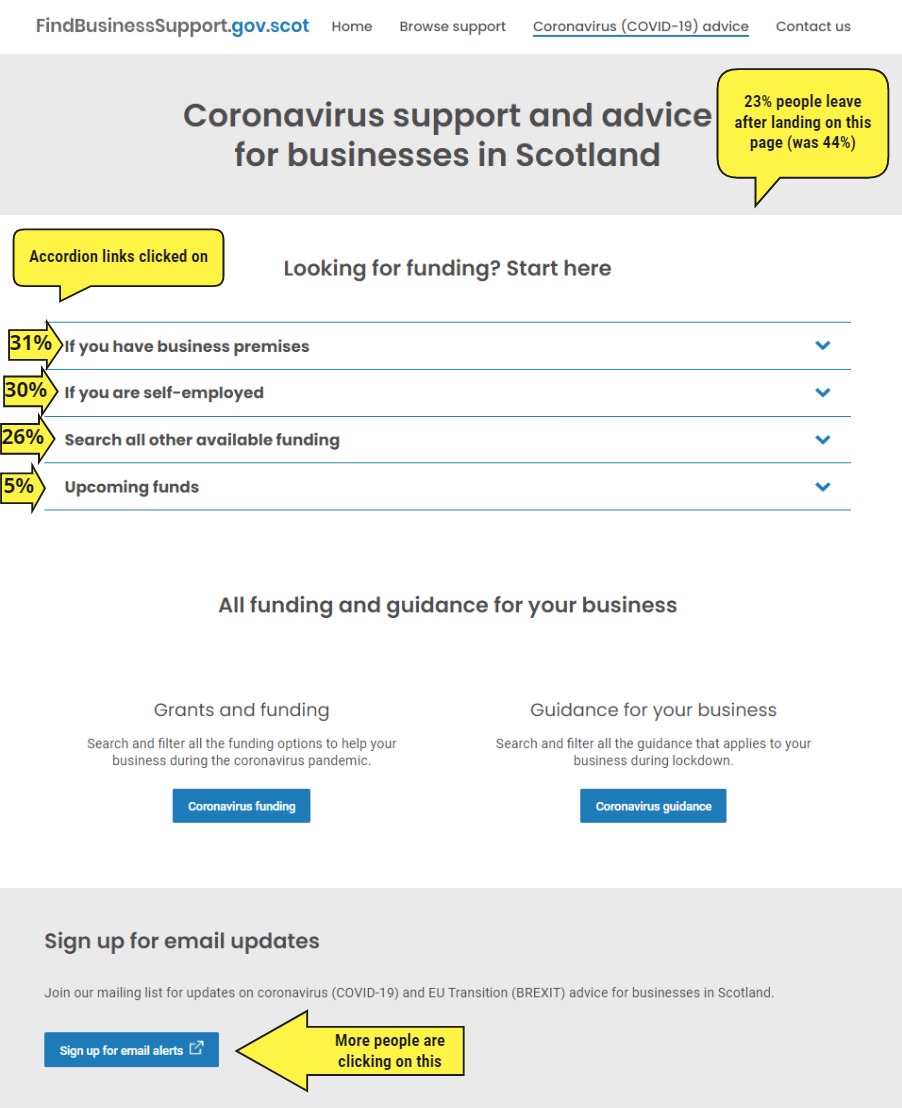
What accordion links have been clicked on the most
- If you have business premises: 31%
- If you are self employed: 30%
- Search all available funding: 26%
- Upcoming funds: 5.43%
Bounce rate - improved!
Cut by half (was 44% and now down to 23% last week). It means people are more likely to engage with the site than leave after landing on the advice page.
New quick guide to coronavirus (Covid-19) business support
Since Friday, 45% of users who come to the ‘quick guide’ leave the website there. This could mean:
- The page is not working because nearly half of users who get to it leave FBS, rather that engage with the site
- Or these users have already found the info they were looking for and this guide has not given them new info
To monitor, but it looks like this page might not be working.
Sign up for email
More people are cliking on it and registering which is good as it’s the best way for customers to be updated.
Check the data yourself
Reminder: You can check the Data Studio dashboard to see the analytics
Stats on the page
